Augmented Reality: Visualization in AR
Team Leadership: Processes & Design Systems
Problem: How do you visualize massive amounts of data on a 2-D screen?
“Every day we generate 2.5 quintillion bytes of data. Data processing rates are growing continuously, so much that 90% of the data in the world today has been created in the last two years alone.” IBM Research
With this amount of data being visualized on a 2-D screen, how can you even begin to see patterns, relationships and outliers without involving numerous data scientists and hours of work?
Approach: Create a stand alone AR Visualization team
Create a small team of highly motivated designers and engineers to explore the space of AR/VR
Provide bandwidth so the team can create tangible results in a short amount of time
Assign one leader to take control of the product and report weekly wins/results. In this case Alfredo Ruiz
As the small teams makes significant progress, open the space up to other studios within IBM
Launch the first major demo at the IBM Think Conference with GM, Rob Thomas
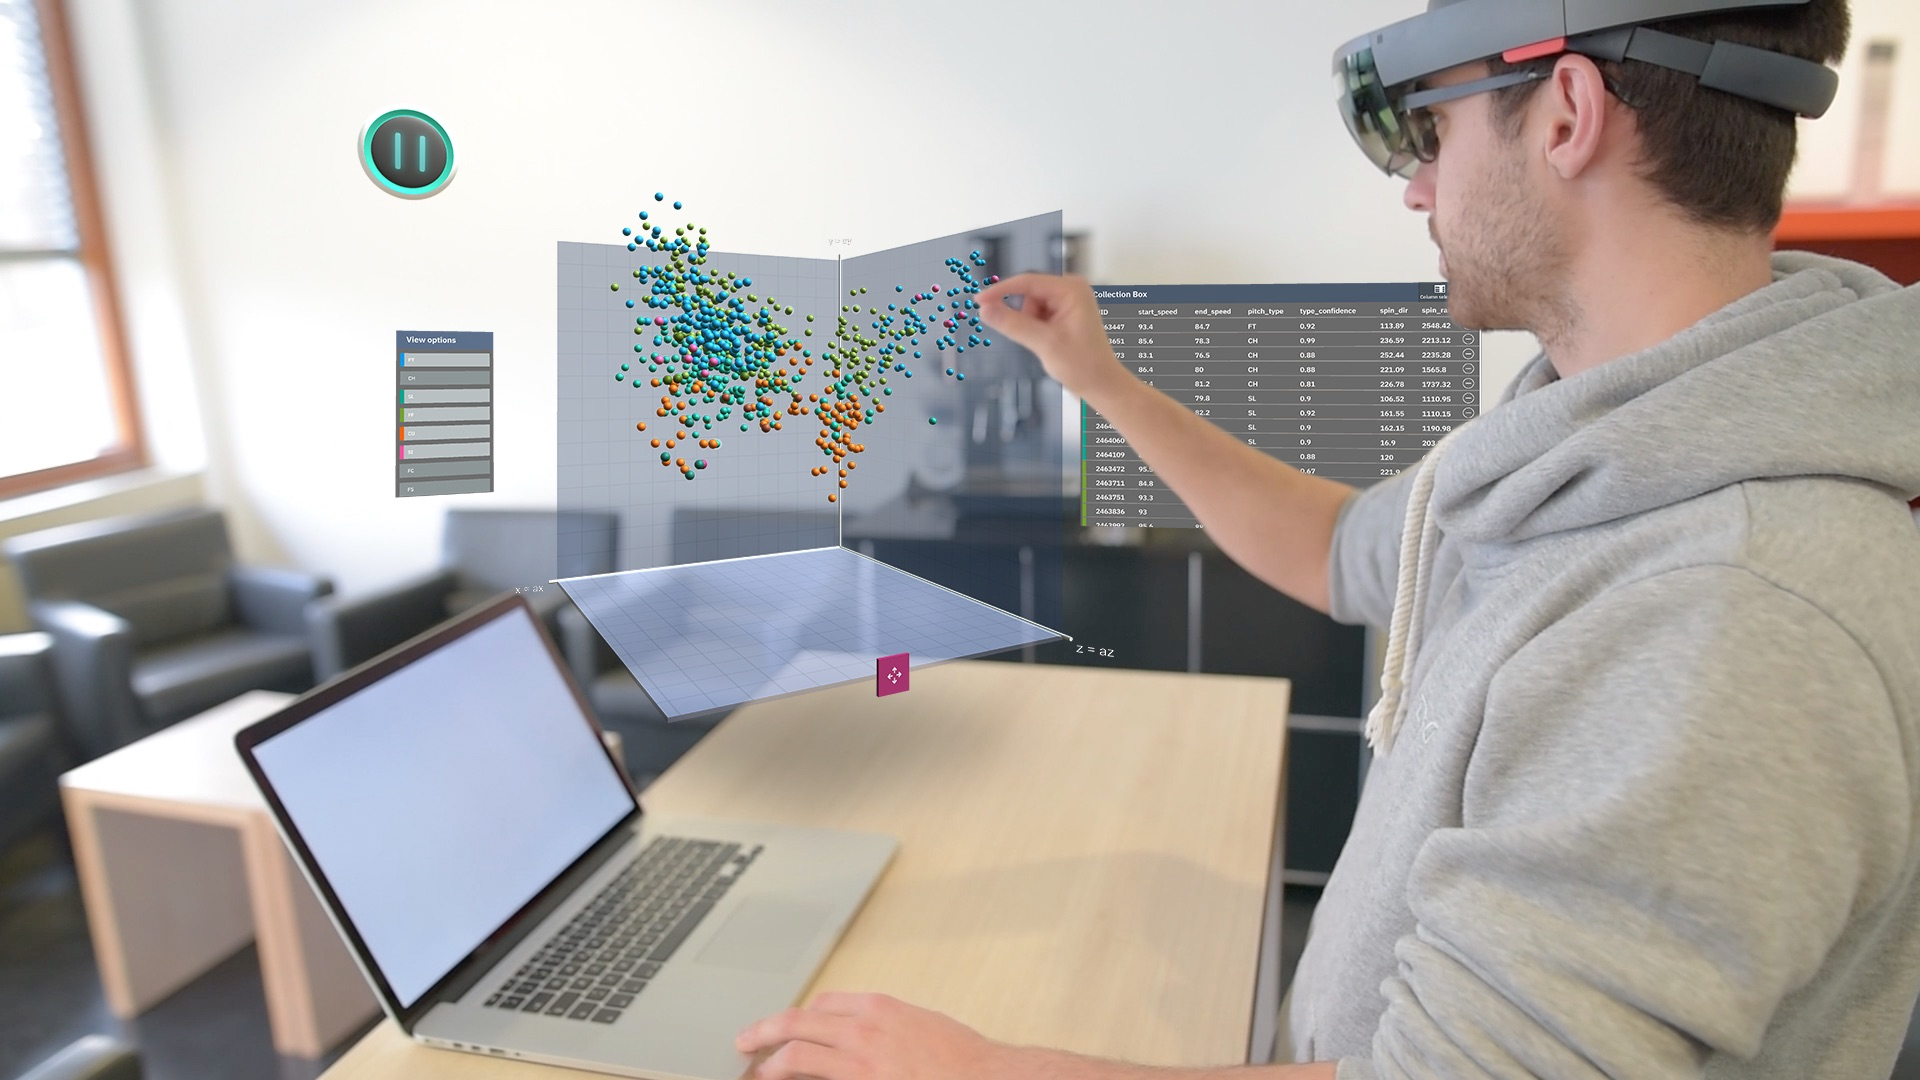
AR plot point using Hololens
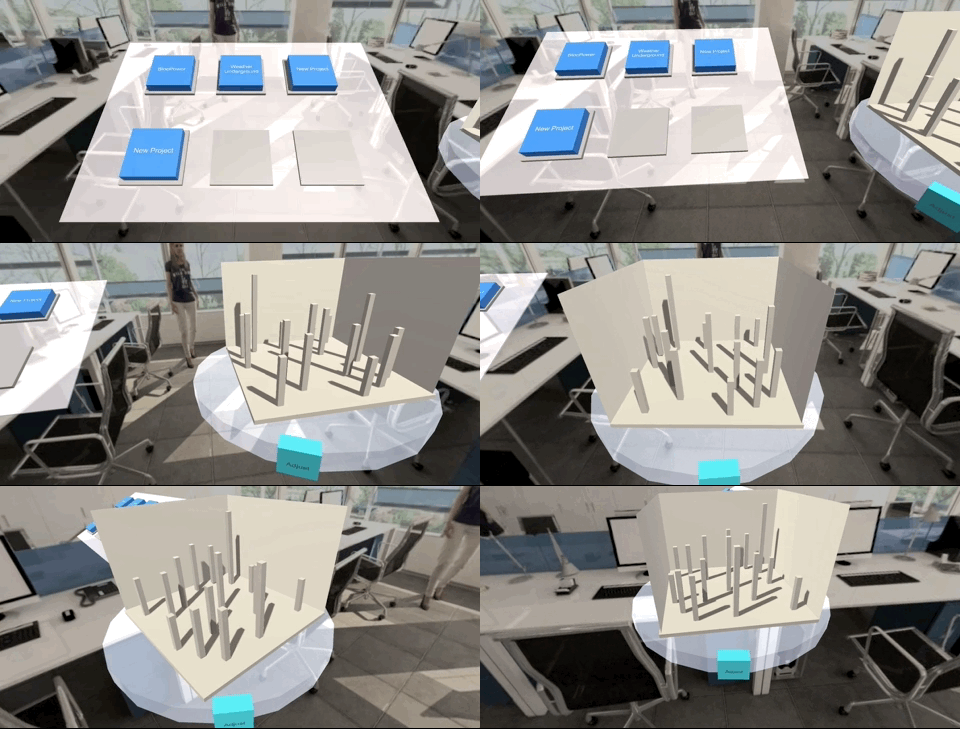
Demo Environment
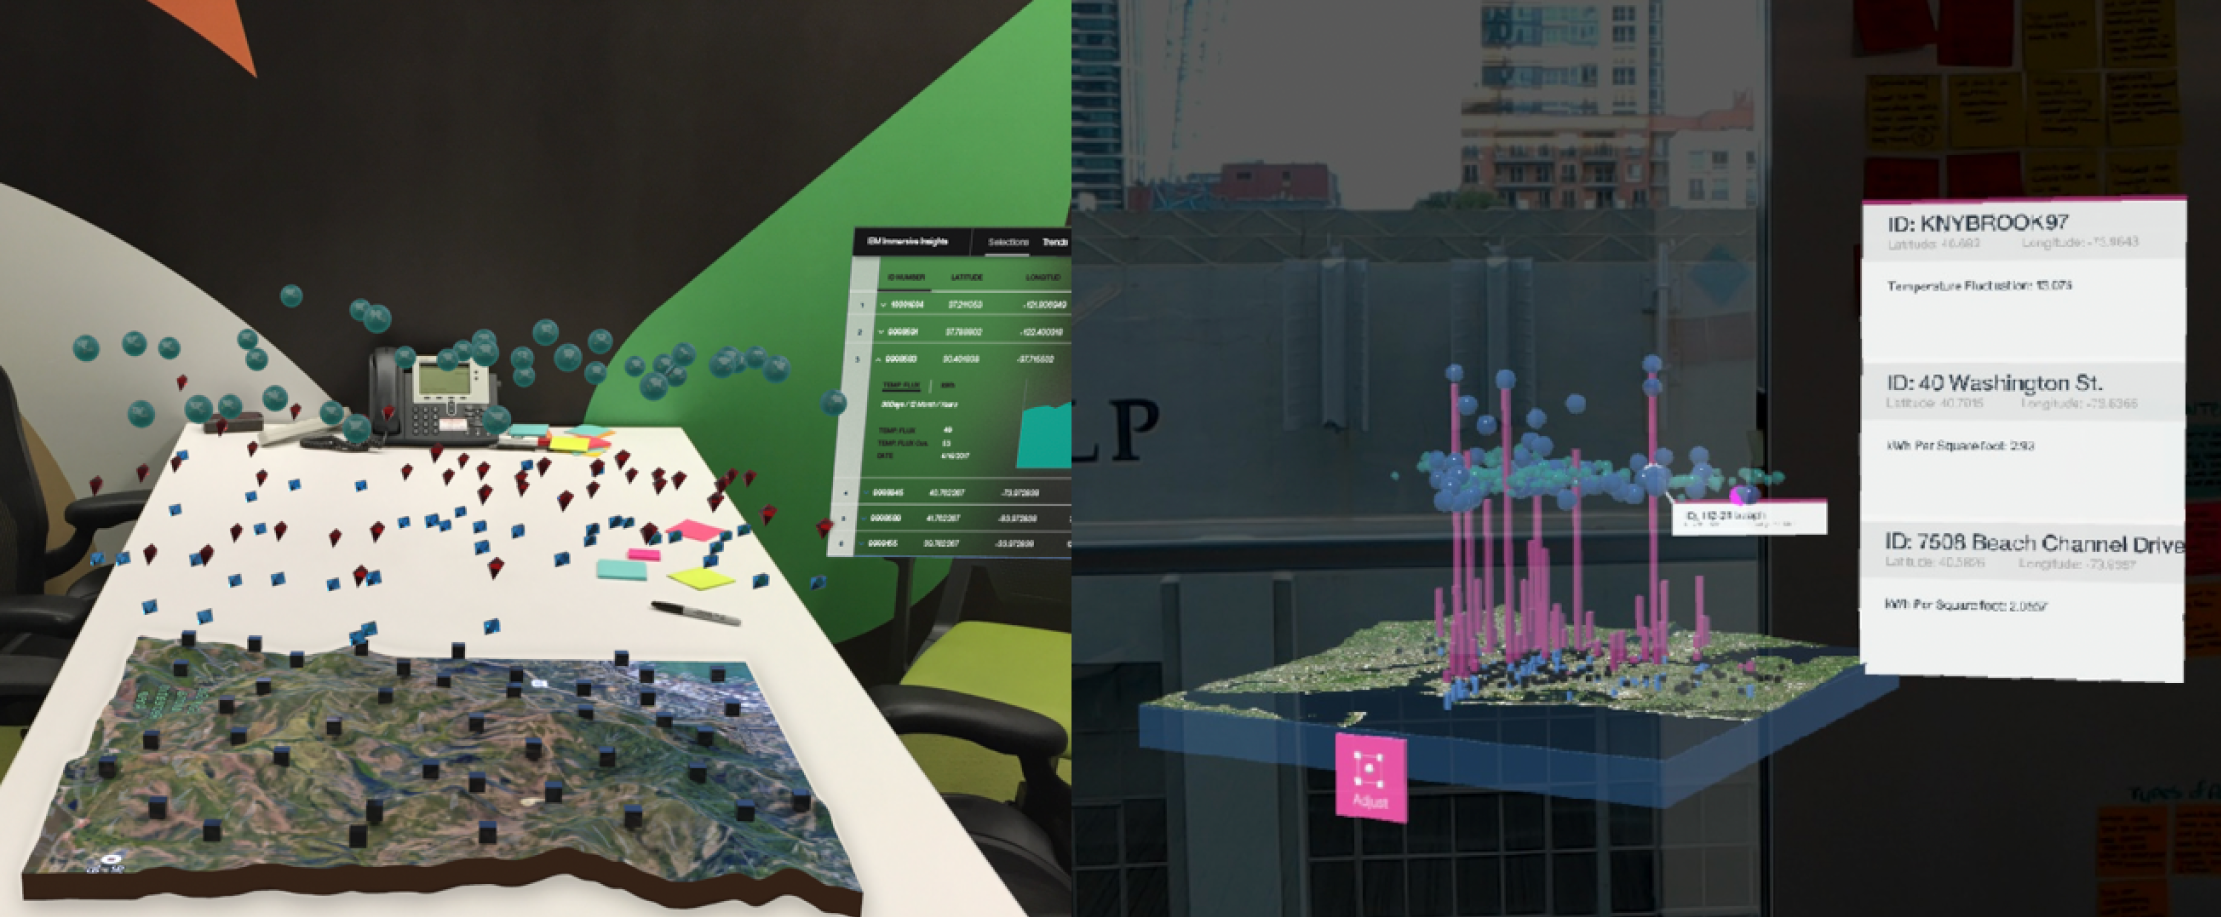
Data visualzation using Hololens AR
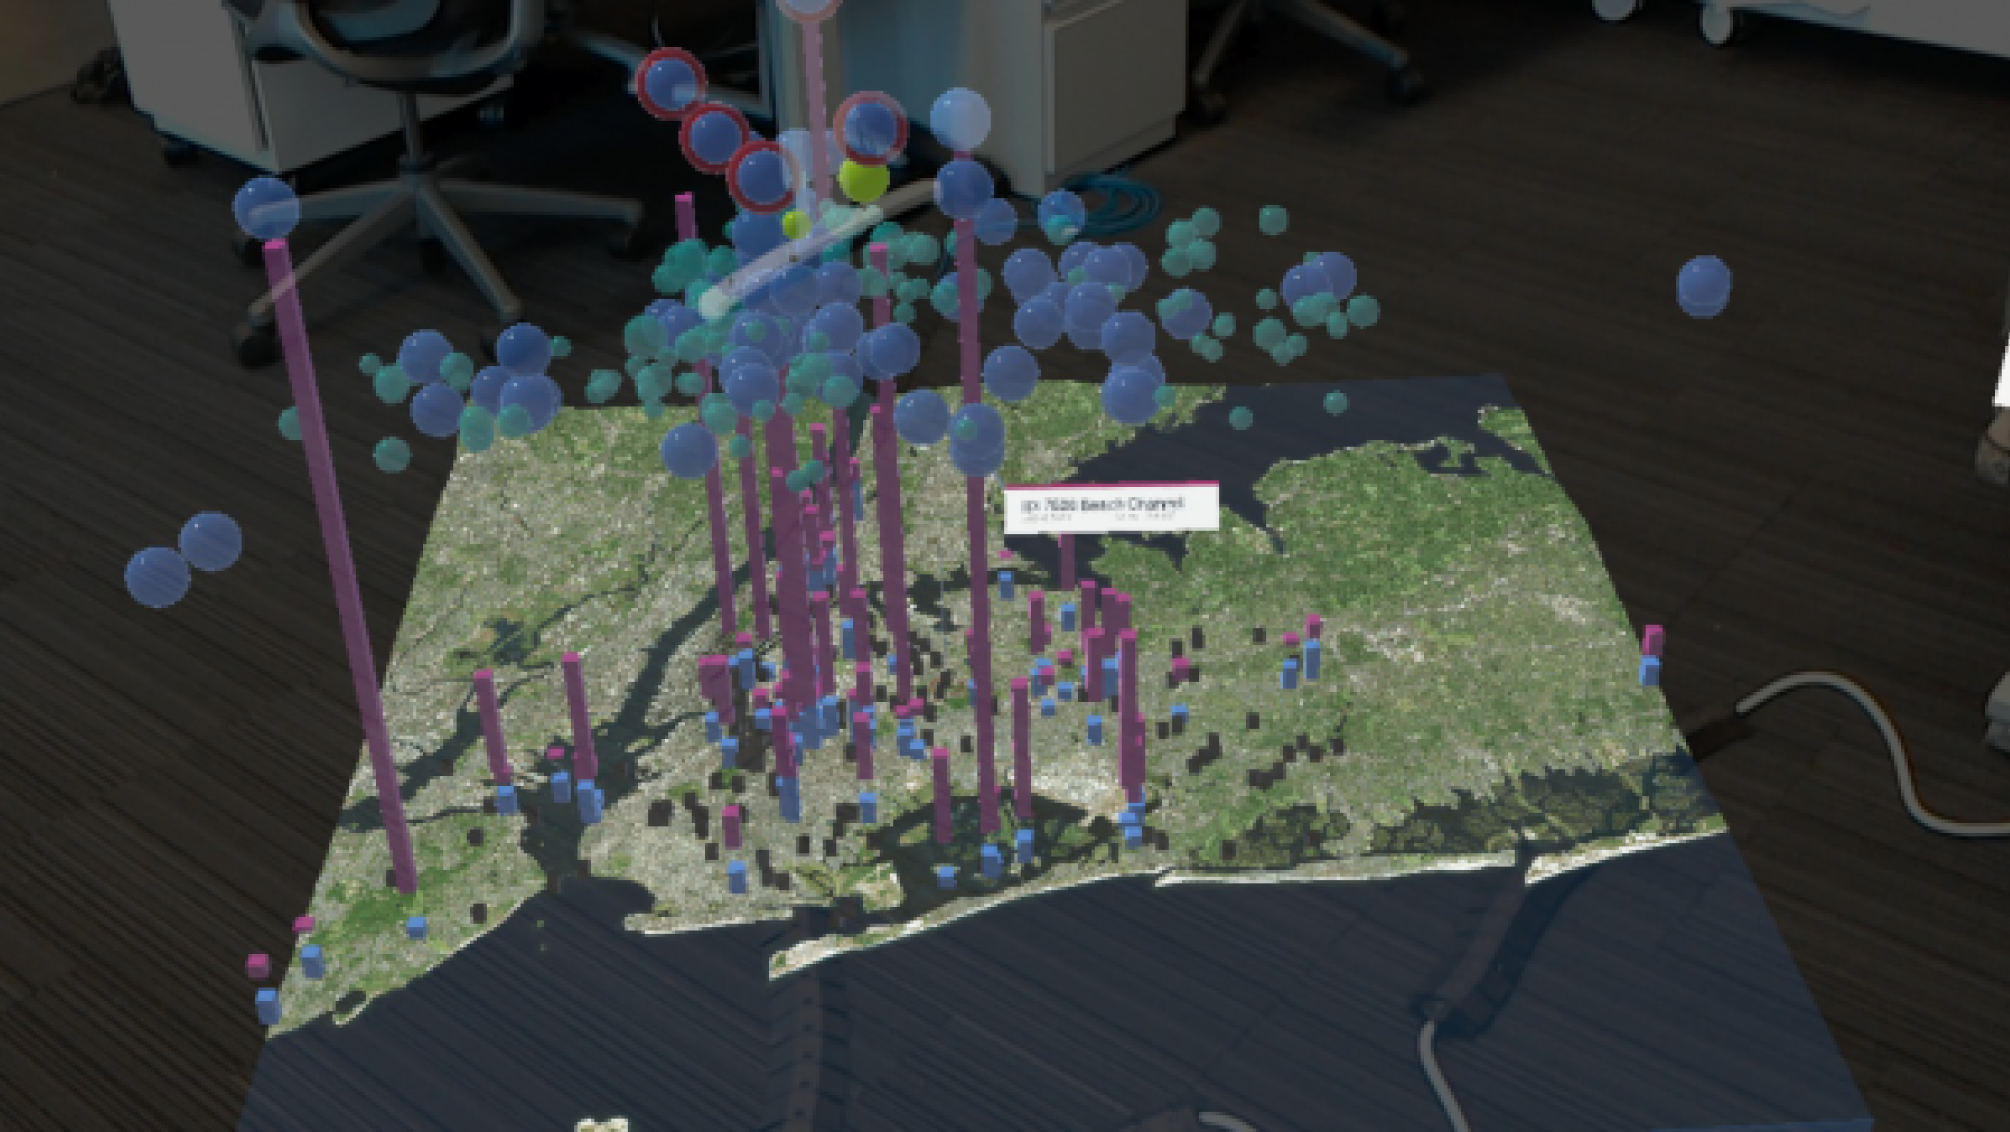
AR plots of NYC energy usage
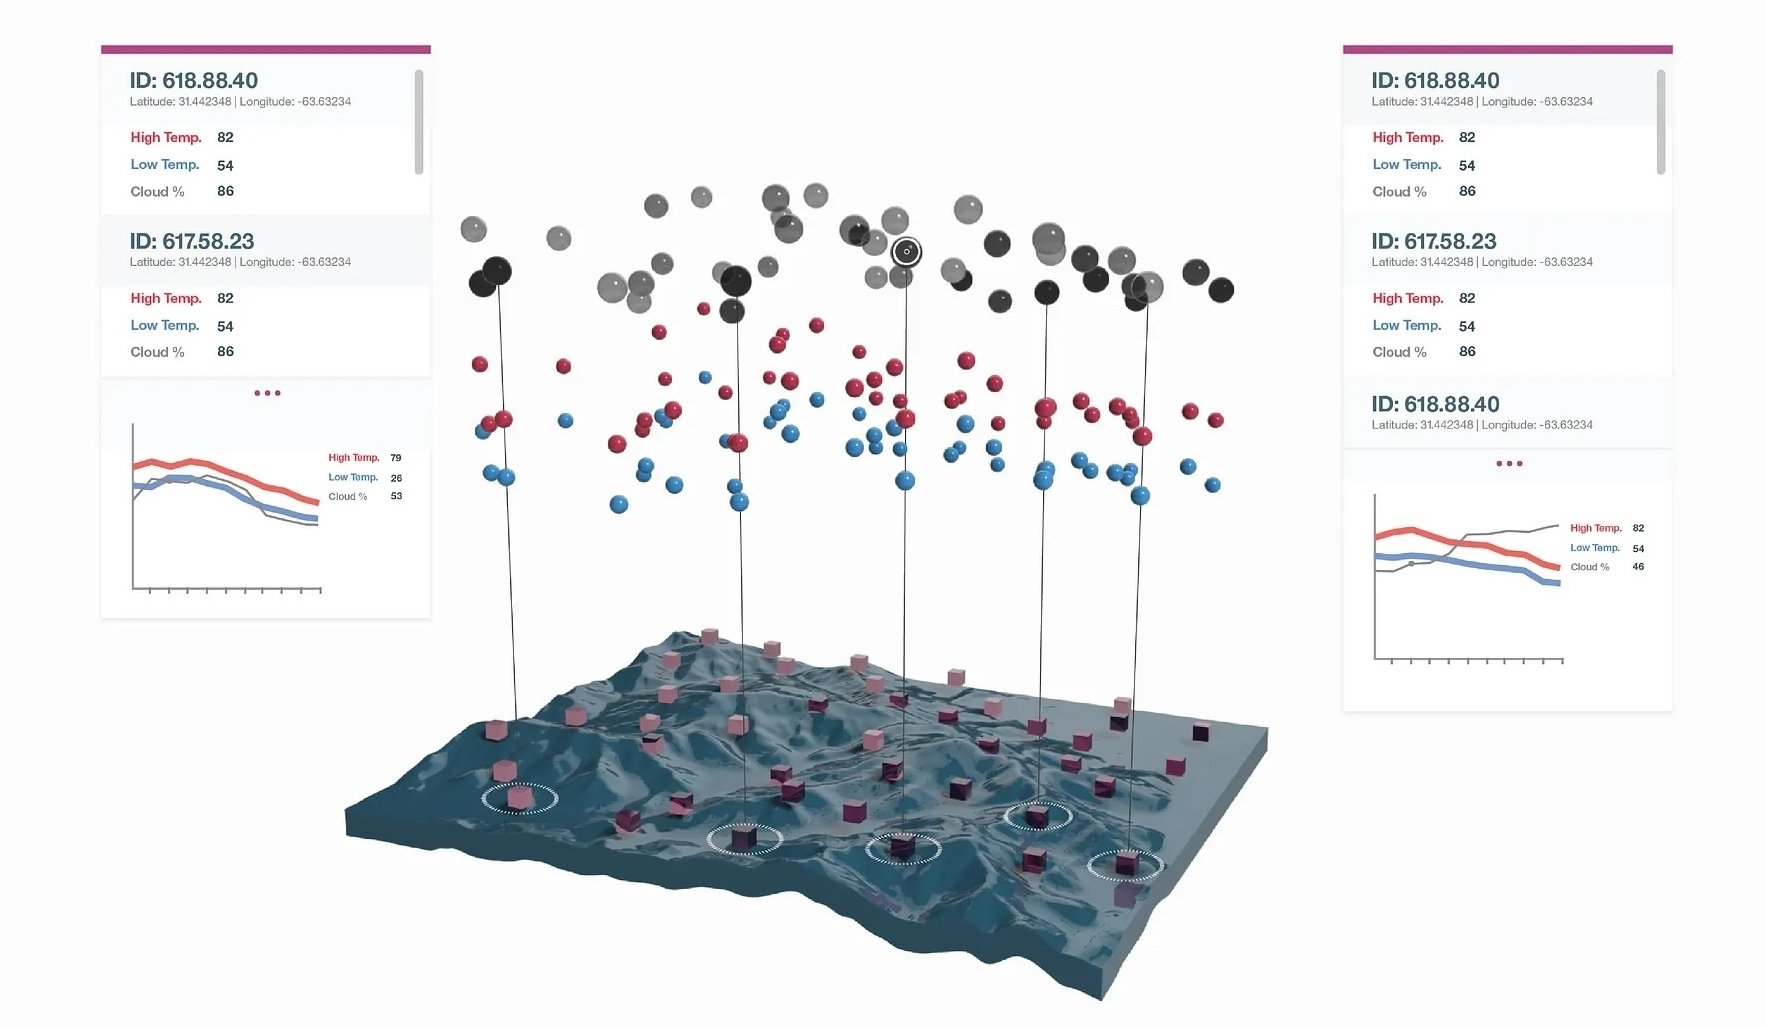
Regional temperature mapping in 3D
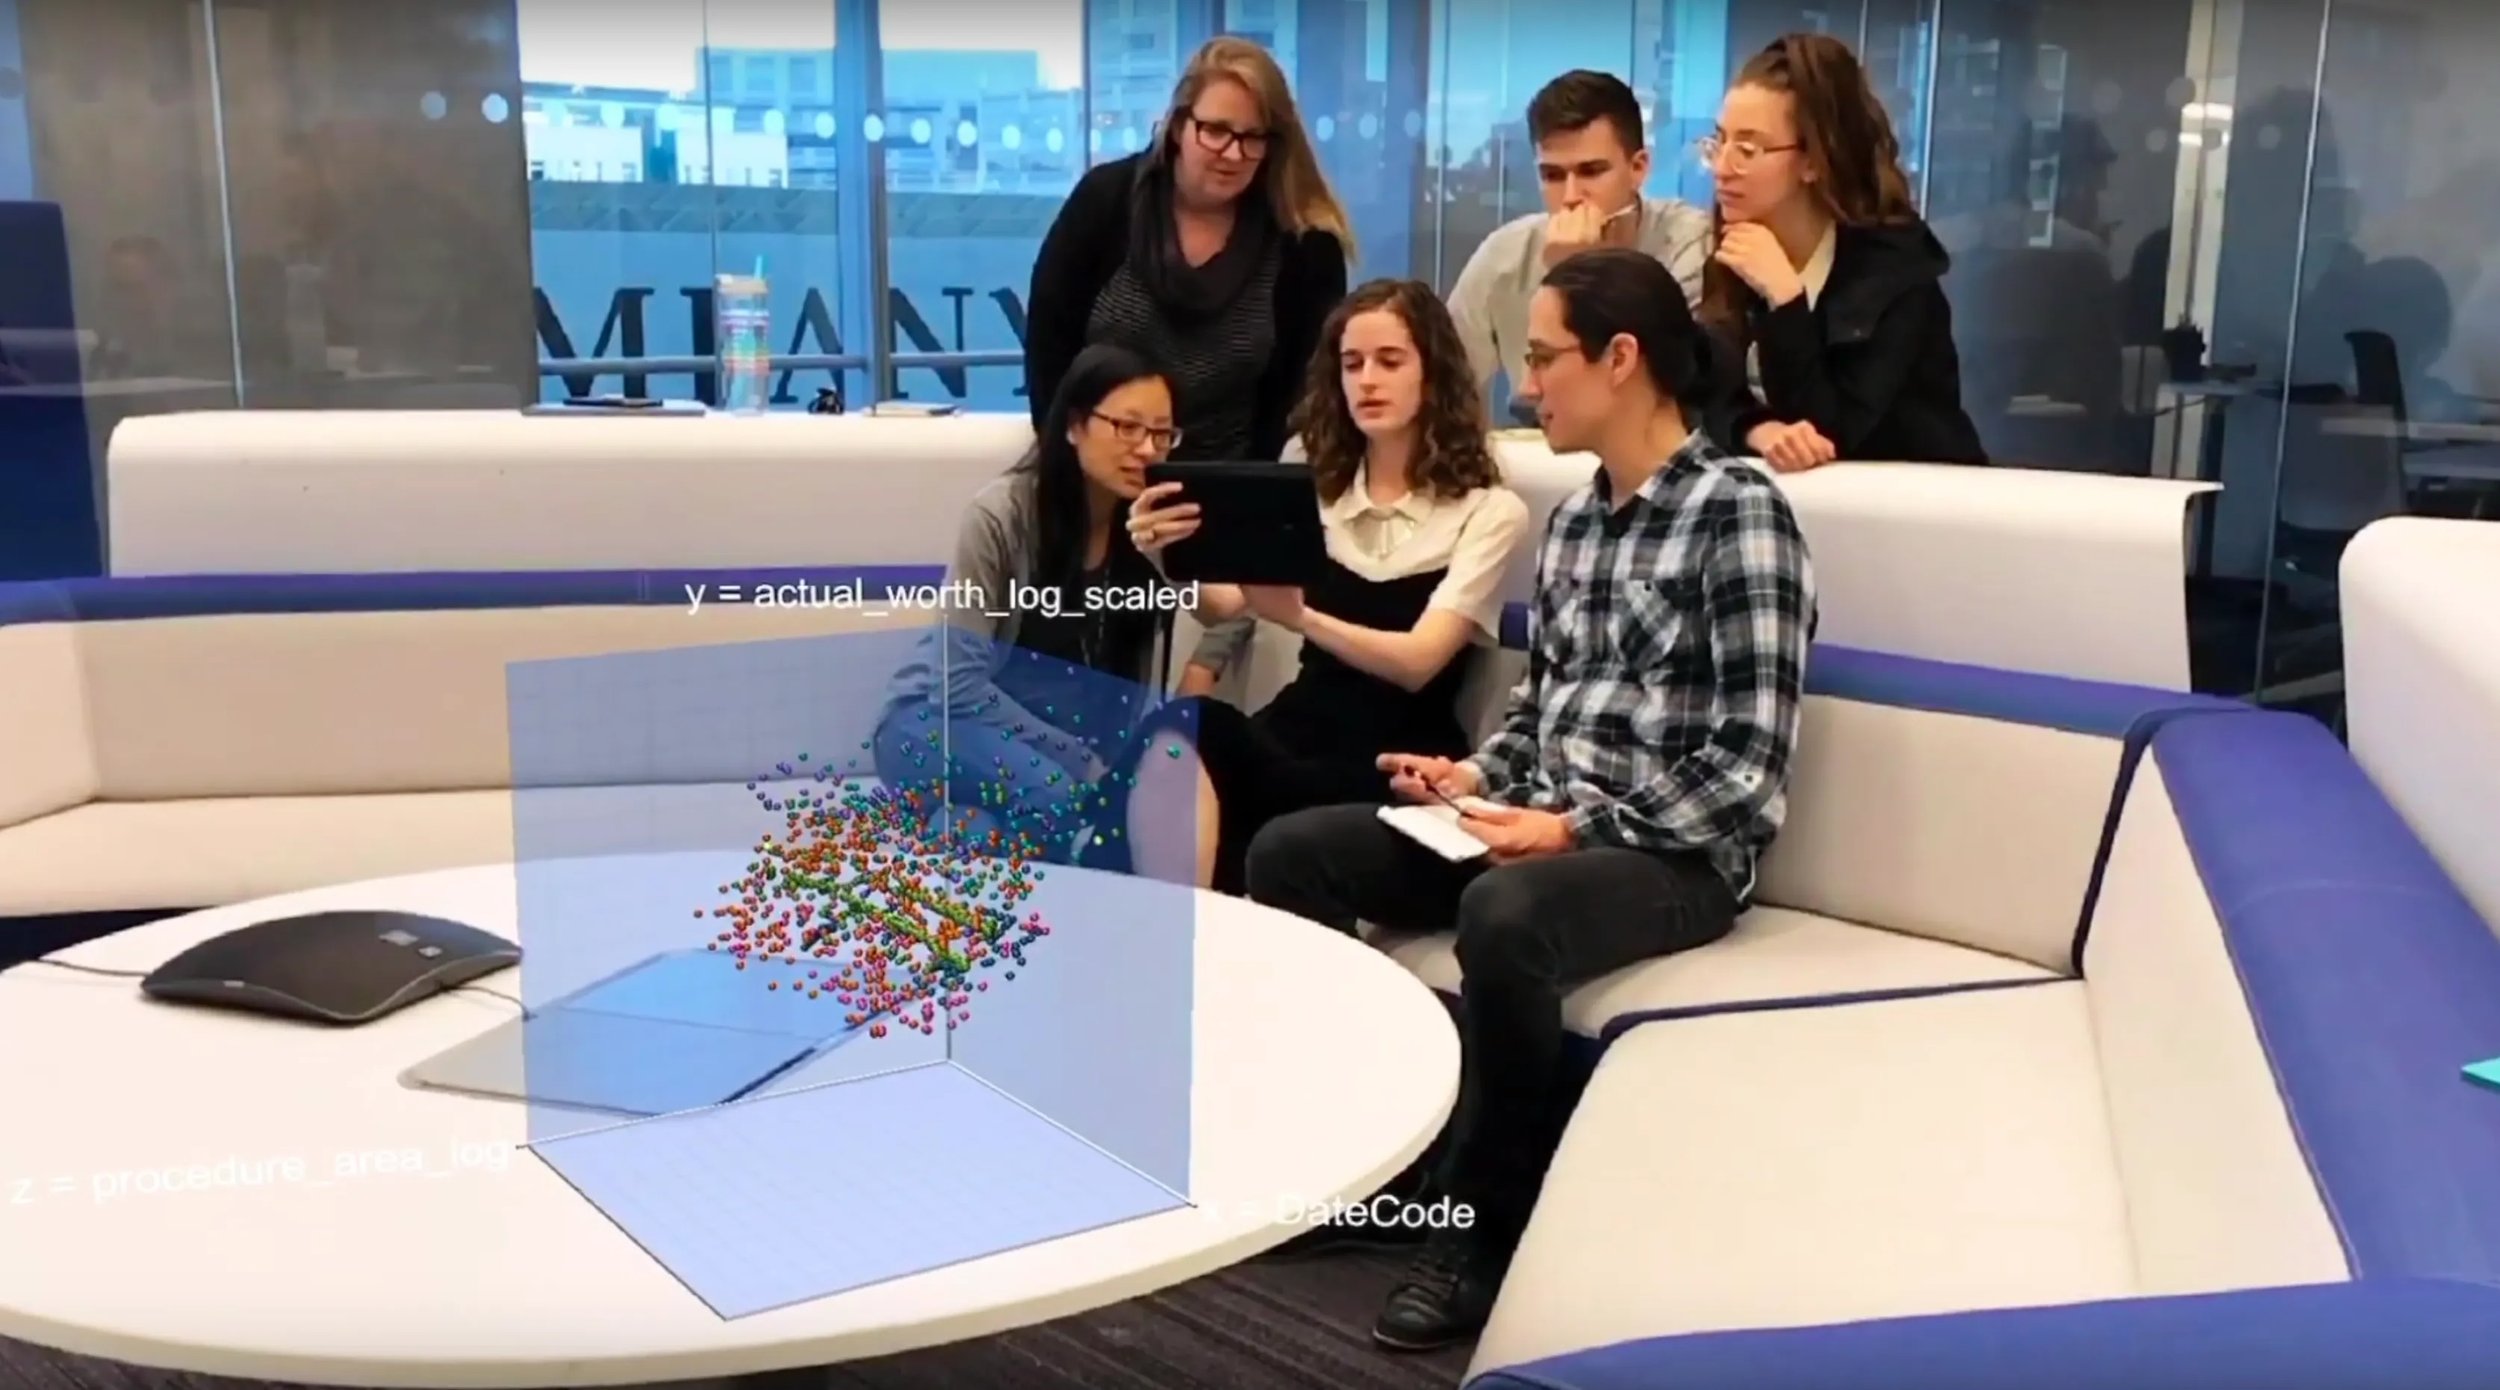
Design team working through prototypes
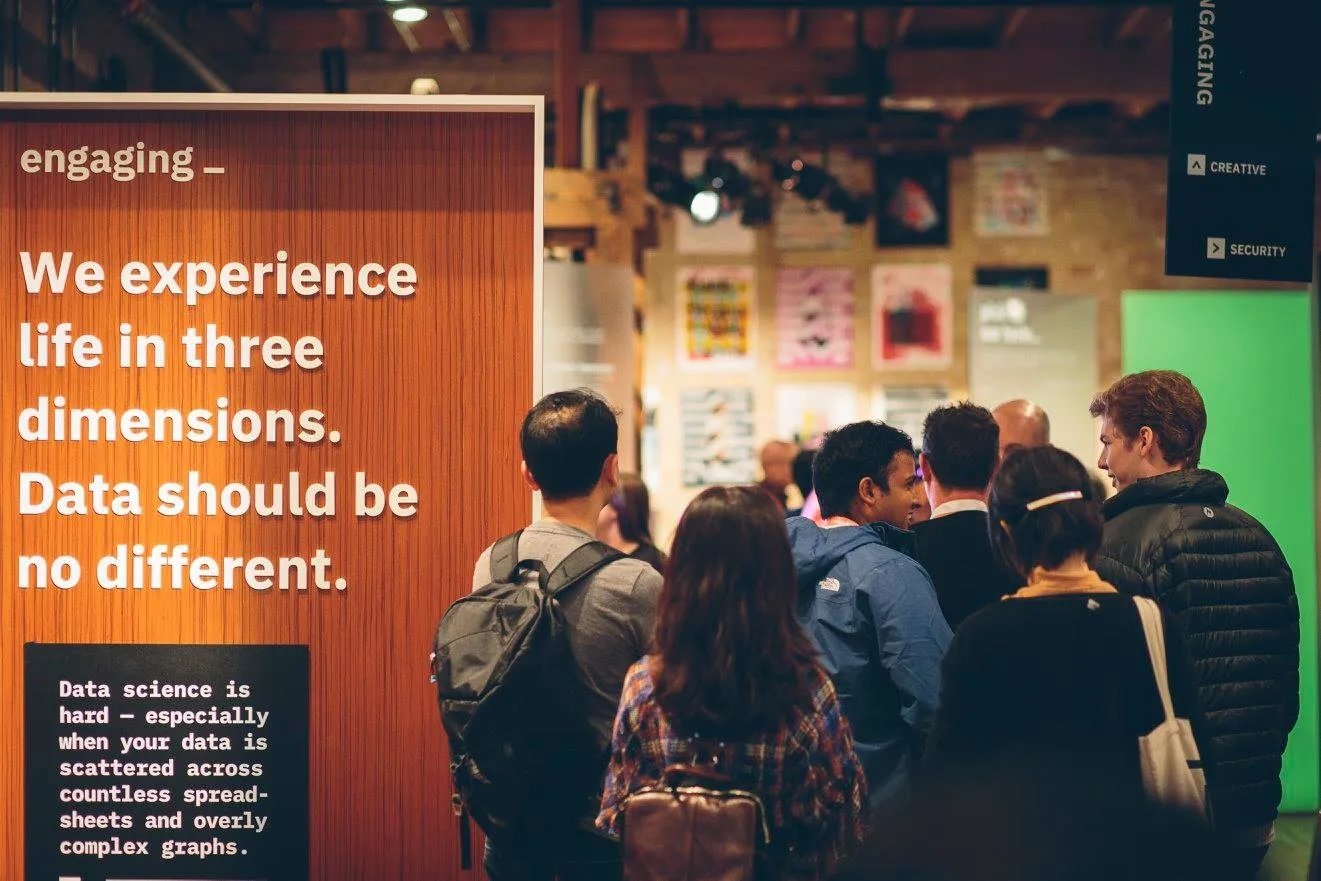
Line at SXSW waiting to experience Immersive Insights

David Townsend presenting at IBM's conferences in Vegas and Johannesburg, Lead designer Alfred Ruiz with IBM CEO Ginni Rometty at the Think conference
“Beyond data science, Immersive Insights has the potential and capacity to be used as a presentation tool, where non-data experts can take advantage of the 3D visuals to better communicate any complex information.”
Immersive Insights through AR visualizations enable any viewer to see in true X-Y-Z perspective.. It can be difficult to see all of the variables with such large data sets on a 2D screen. Immersive Insights allow you, the viewer to literally be in the middle of large data fields, 3D visualization models, and large data clusters, and control your perspective. Data that was hidden, outside typical views now can be clearly seen.
By allowing designers the flexibility to explore new technologies and fields keeps them engaged, and allows them to explore other areas within your organization reducing the chance of turnover. It also provides career opportunities within your company while surprising your leadership with new demo’s and direction.
